Share The Meal Research Project
This project explored how to improve donor engagement and trust by leveraging research-driven insights to inform a user-centered feature concept.
Company
Share The Meal
Timeline
1 month
Role
UX, UI Designer
Share The Meal Research Project
This project explored how to improve donor engagement and trust by leveraging research-driven insights to inform a user-centered feature concept.
Company
Share The Meal
Timeline
1 month
Role
UX, UI Designer

When we think about global challenges like hunger, we often imagine the scale: millions of people affected, billions of dollars in aid, and countless lives depending on support. But behind every donation is a single human being making a choice—one tap, one moment of empathy, one gesture of trust.
This project explored how to improve donor engagement and trust in ShareTheMeal by leveraging research-driven insights to inform a user-centered feature concept.
ShareTheMeal is a donation app created by the United Nations World Food Programme (WFP). Our team was asked to explore opportunities to improve user engagement and strengthen trust, with the long-term goal of encouraging more consistent giving.
As part of a 5-member design team, I worked across research, insight synthesis, and early concept development to help shape a feature that could bring donors closer to the causes they care about.
Understanding the Challenge
Like many donation platforms, ShareTheMeal faces a recurring issue: people download the app, donate once or twice, and then gradually disengage. We needed to understand why.
Our objectives were clear:
Improve retention by keeping donors connected and motivated
Strengthen trust through clearer visibility of impact
Increase the number of long term value donors (LTV)
These goals pointed us toward a deeper question:
What truly keeps someone engaged in charitable giving over time?
Research
Listening First: Stakeholder and User Insights
Our project began with a conversation with WFP stakeholders, who emphasized a key problem: users often don’t feel certain their donations make a difference. This lack of visibility weakens trust and, over time, leads to disengagement.
From our research, we identified what mattered most to both users and the business.
For the user:
Seeing the tangible impact of their donations and staying updated
Feeling personal fulfillment from donating
Knowing they are making a positive difference in the world
For business:
Expanding beyond traditional food and monetary donations
Prioritizing long-term sustainable goals
Increasing recurring donor engagement and overall revenue
By bringing these perspectives together, we were able to ensure our design solutions addressed both human motivations and strategic objectives.
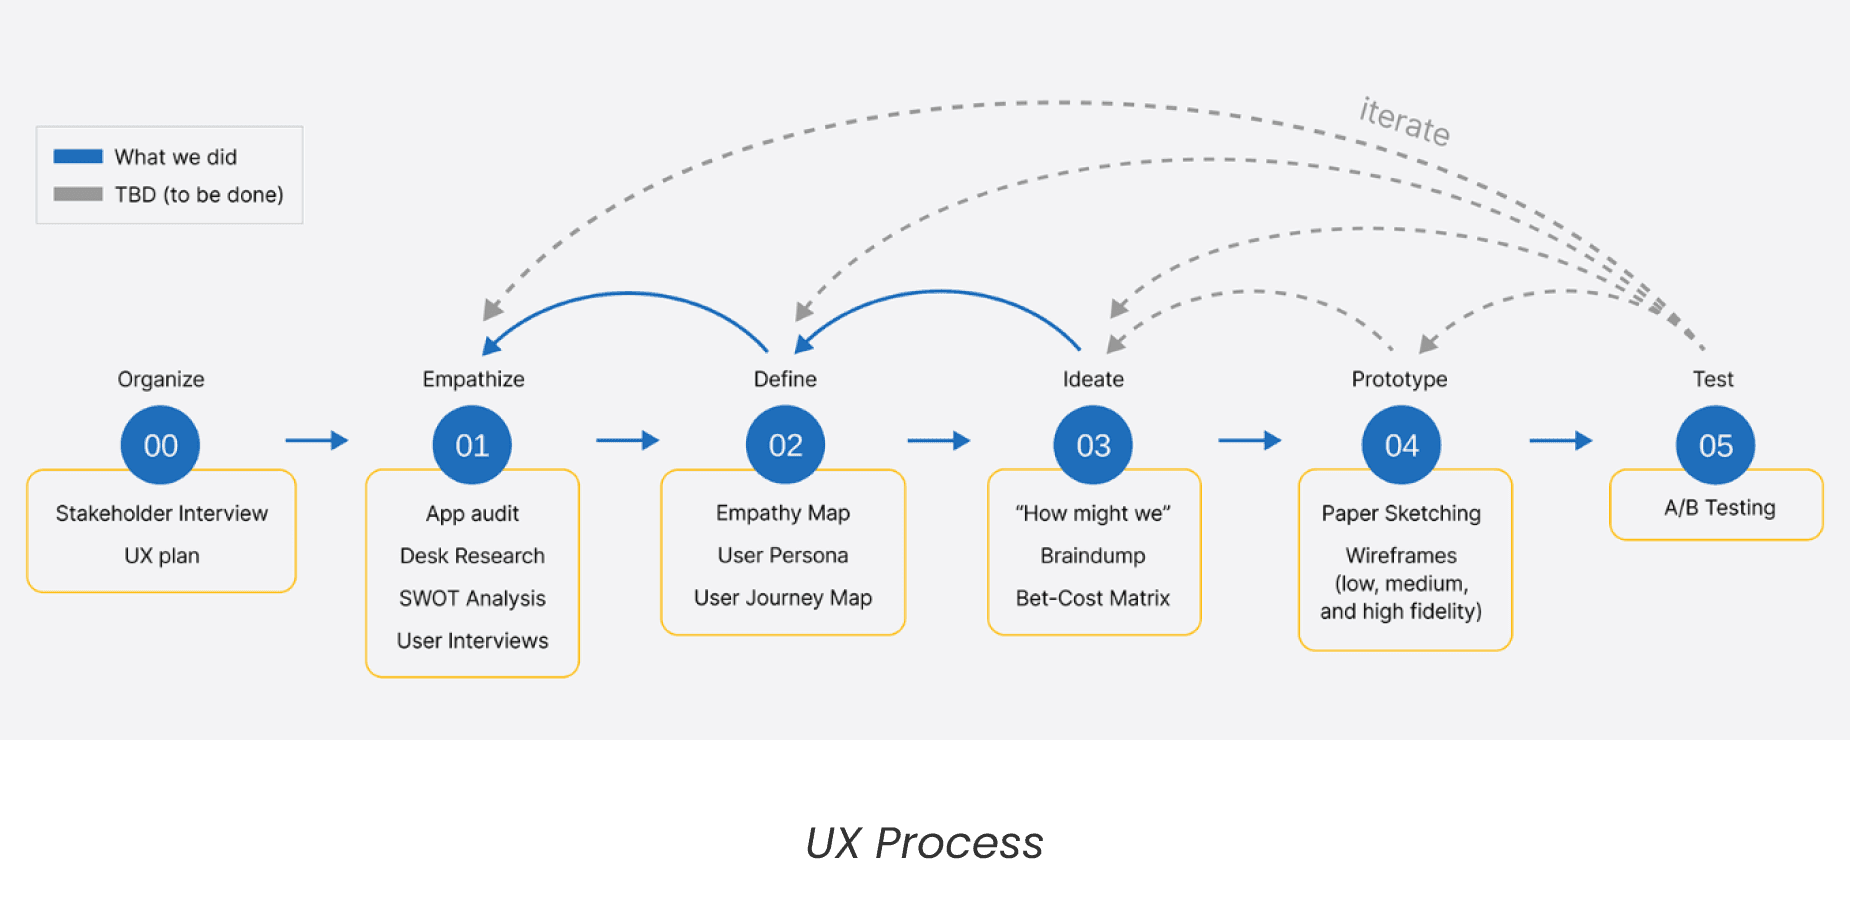
Process Overview
What the Literature Says About Donor Behavior
Through desk research, we got to know our users and their values even better. We analyzed three different articles that were connected to our goals. The main takeaway that we found all authors pointing out was the importance of information as a basis for building trust.
Uncertainty reduces action. Information builds confidence.
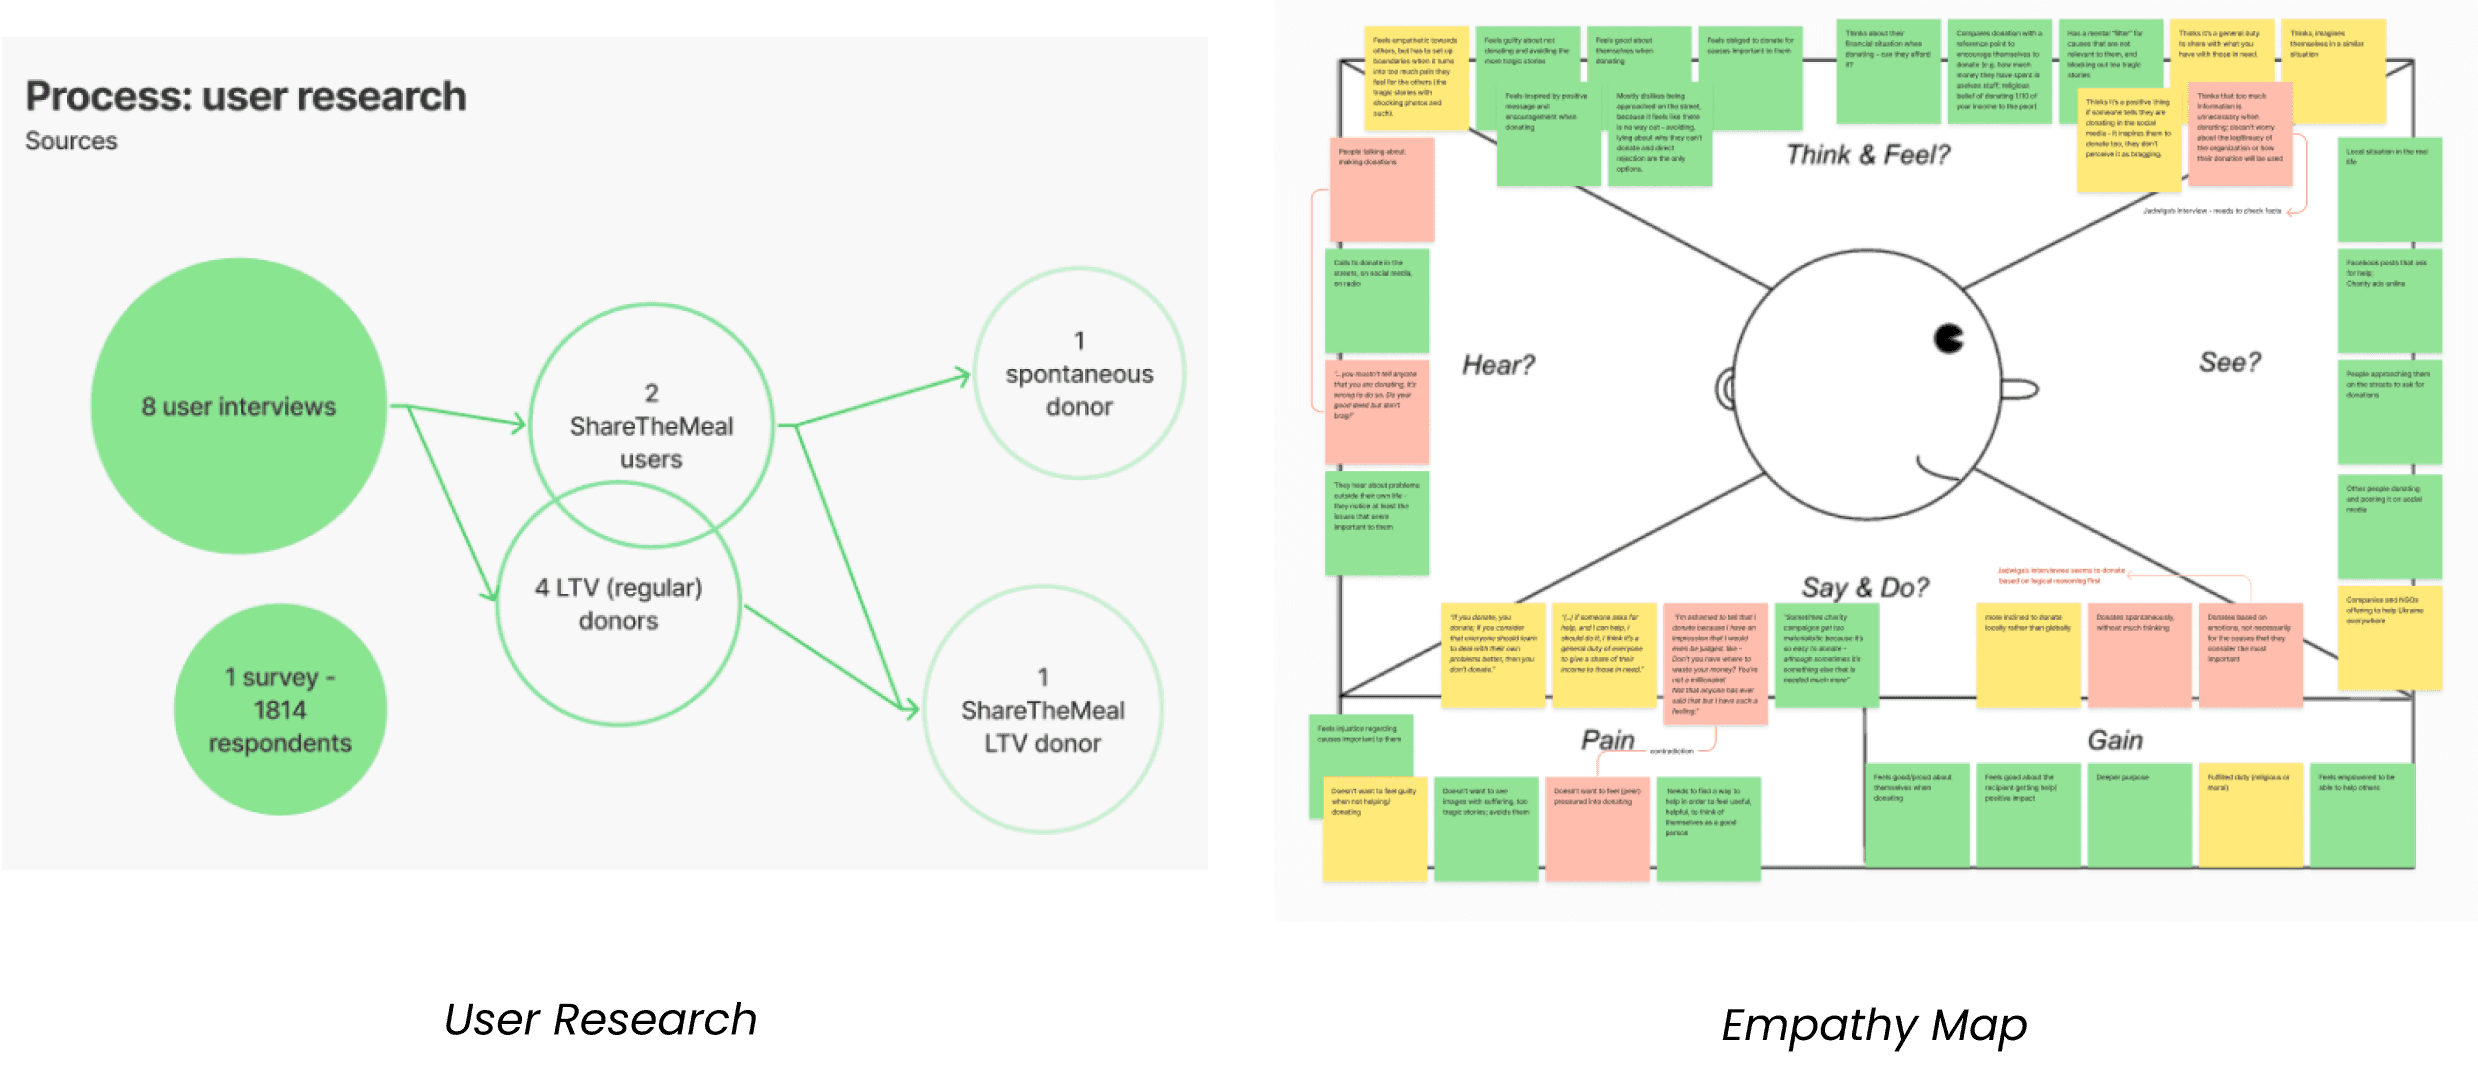
Mapping Emotions and Decisions
To better understand the donor perspective, we conducted eight in-depth user interviews supported by survey data. From this, several themes emerged:
People feel motivated when they can see the impact of their generosity
Too many choices create hesitation and even guilt
A simple, low-effort interaction often feels more rewarding than complex decision-making
These early insights helped us refocus the problem:
Donors aren’t disengaging because they don’t care—they’re disengaging because the experience doesn’t support their emotional needs.
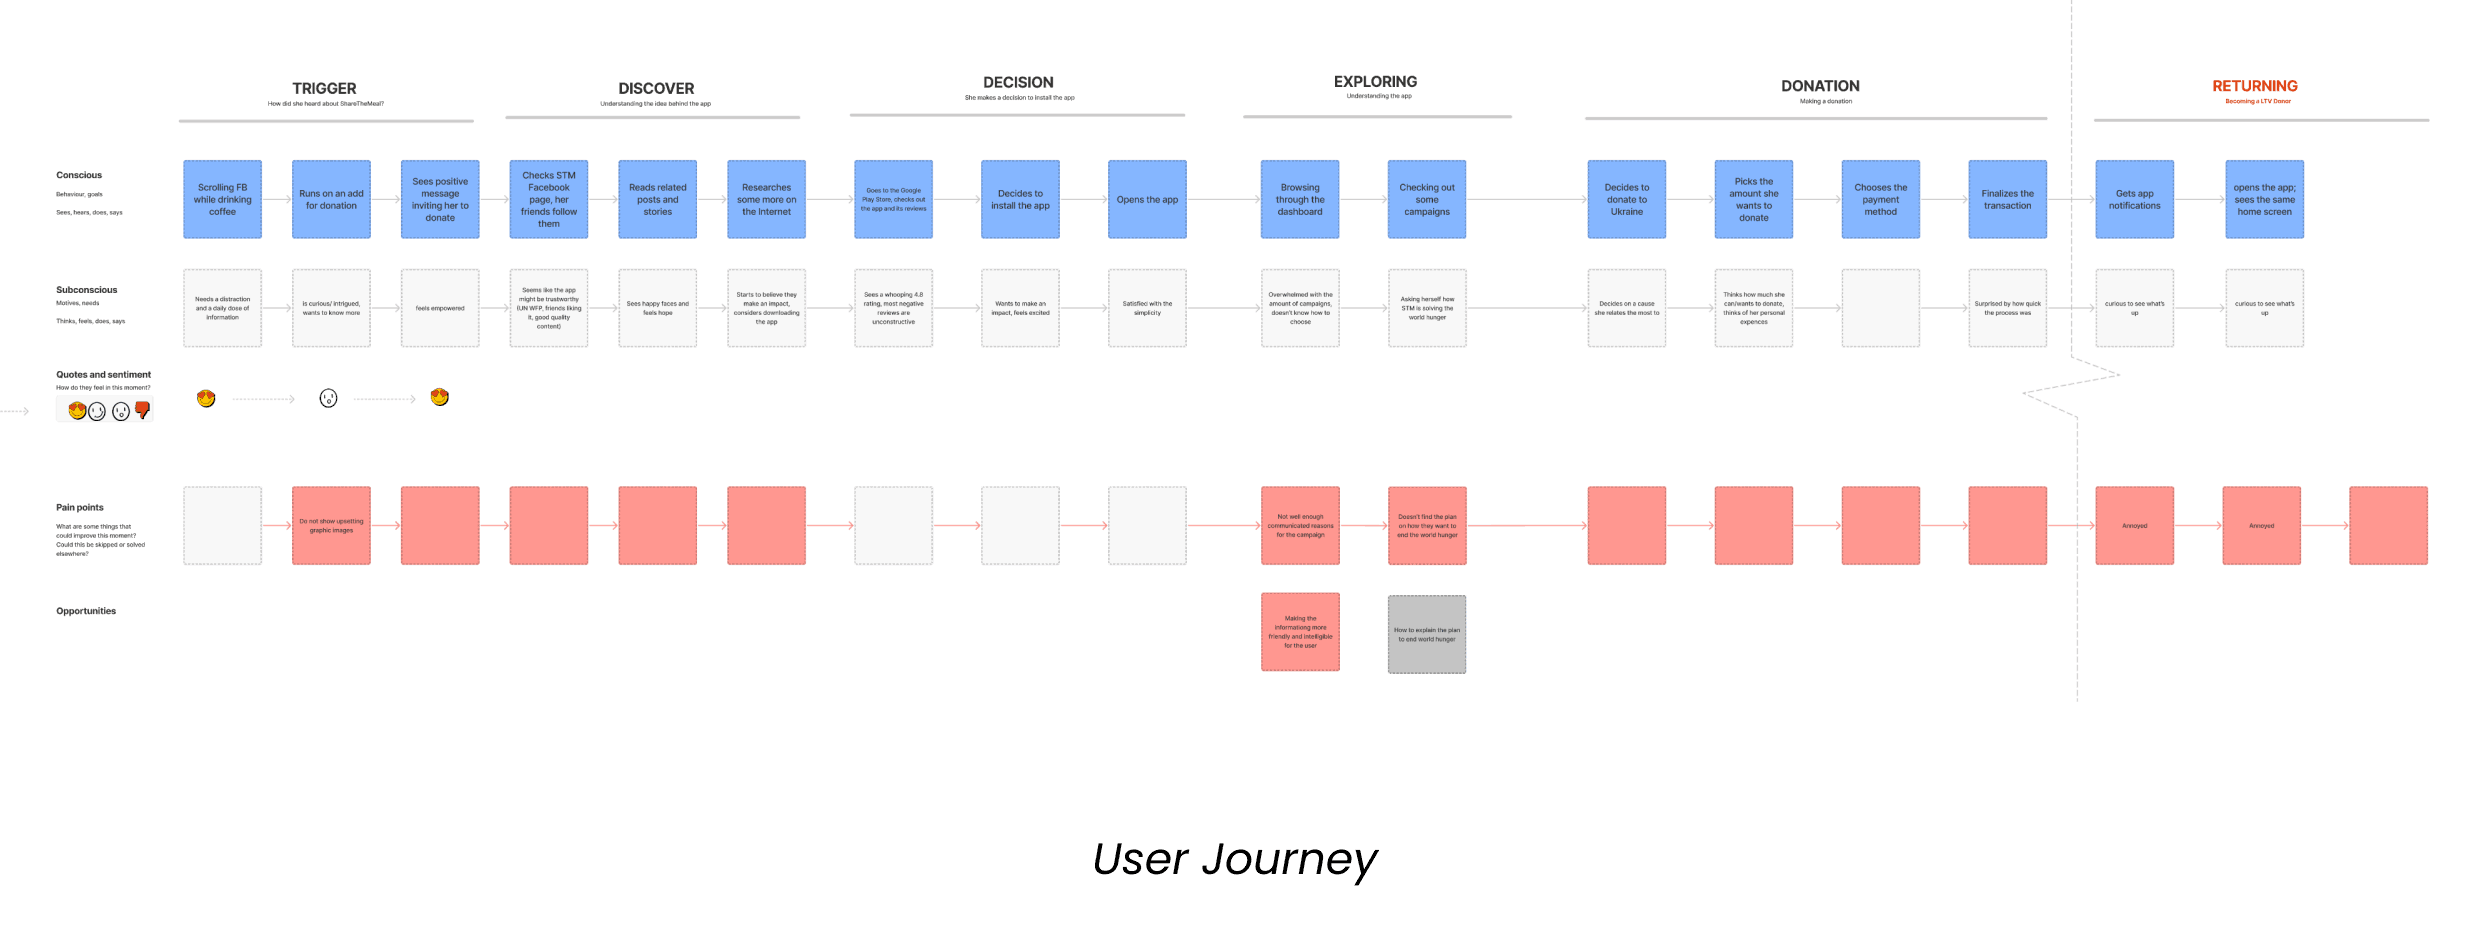
With this understanding, we synthesized our findings into an empathy map to clarify what donors think, feel, and struggle with.
This helped us develop a persona named Donna—a well-intentioned donor who wants her contributions to matter but often feels overwhelmed choosing where to give.
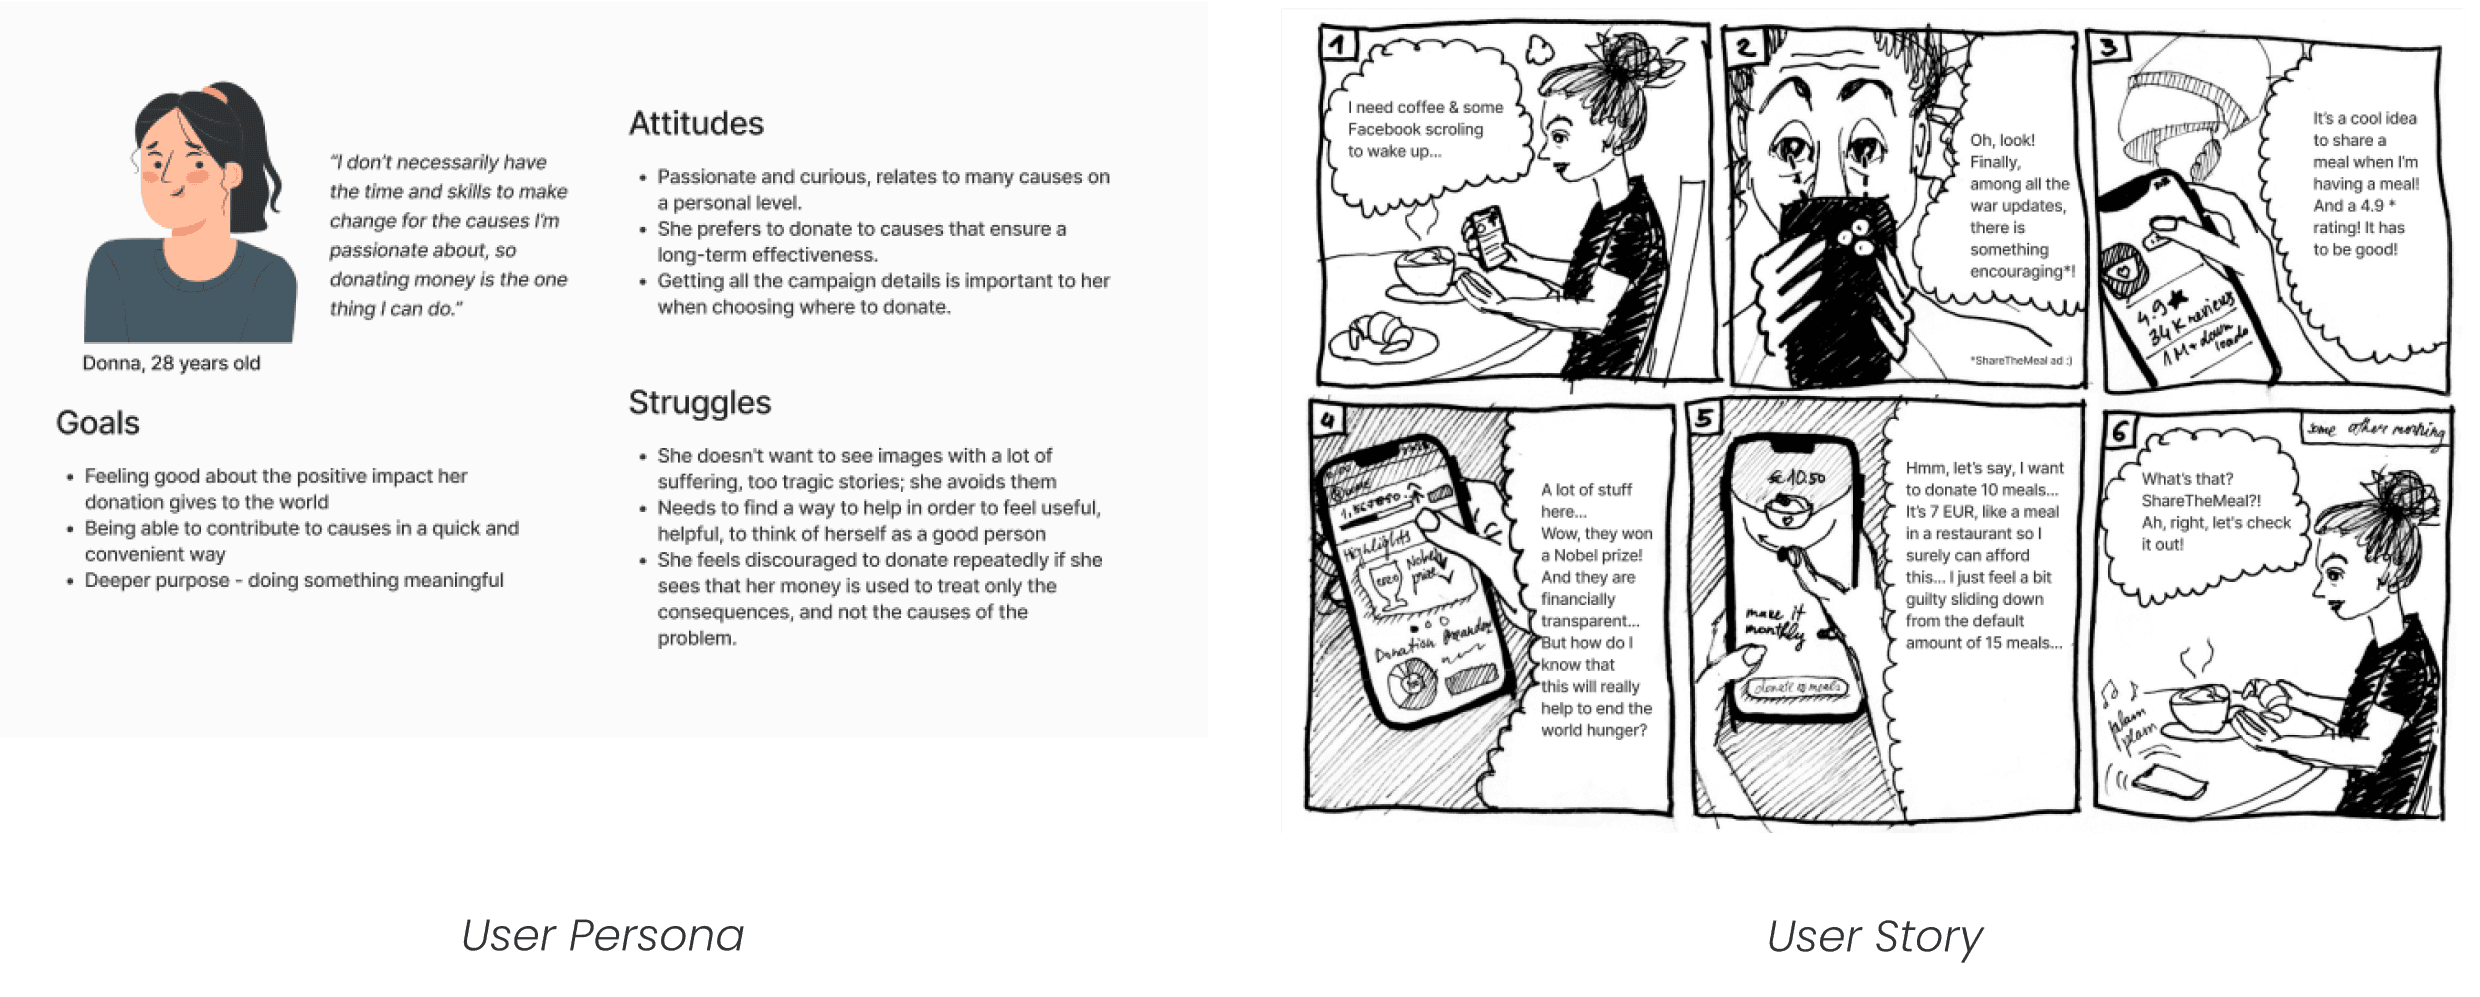
Following Donna’s journey from app discovery to donation revealed several friction points, especially around decision fatigue and unclear impact. These became the foundation for our ideation.
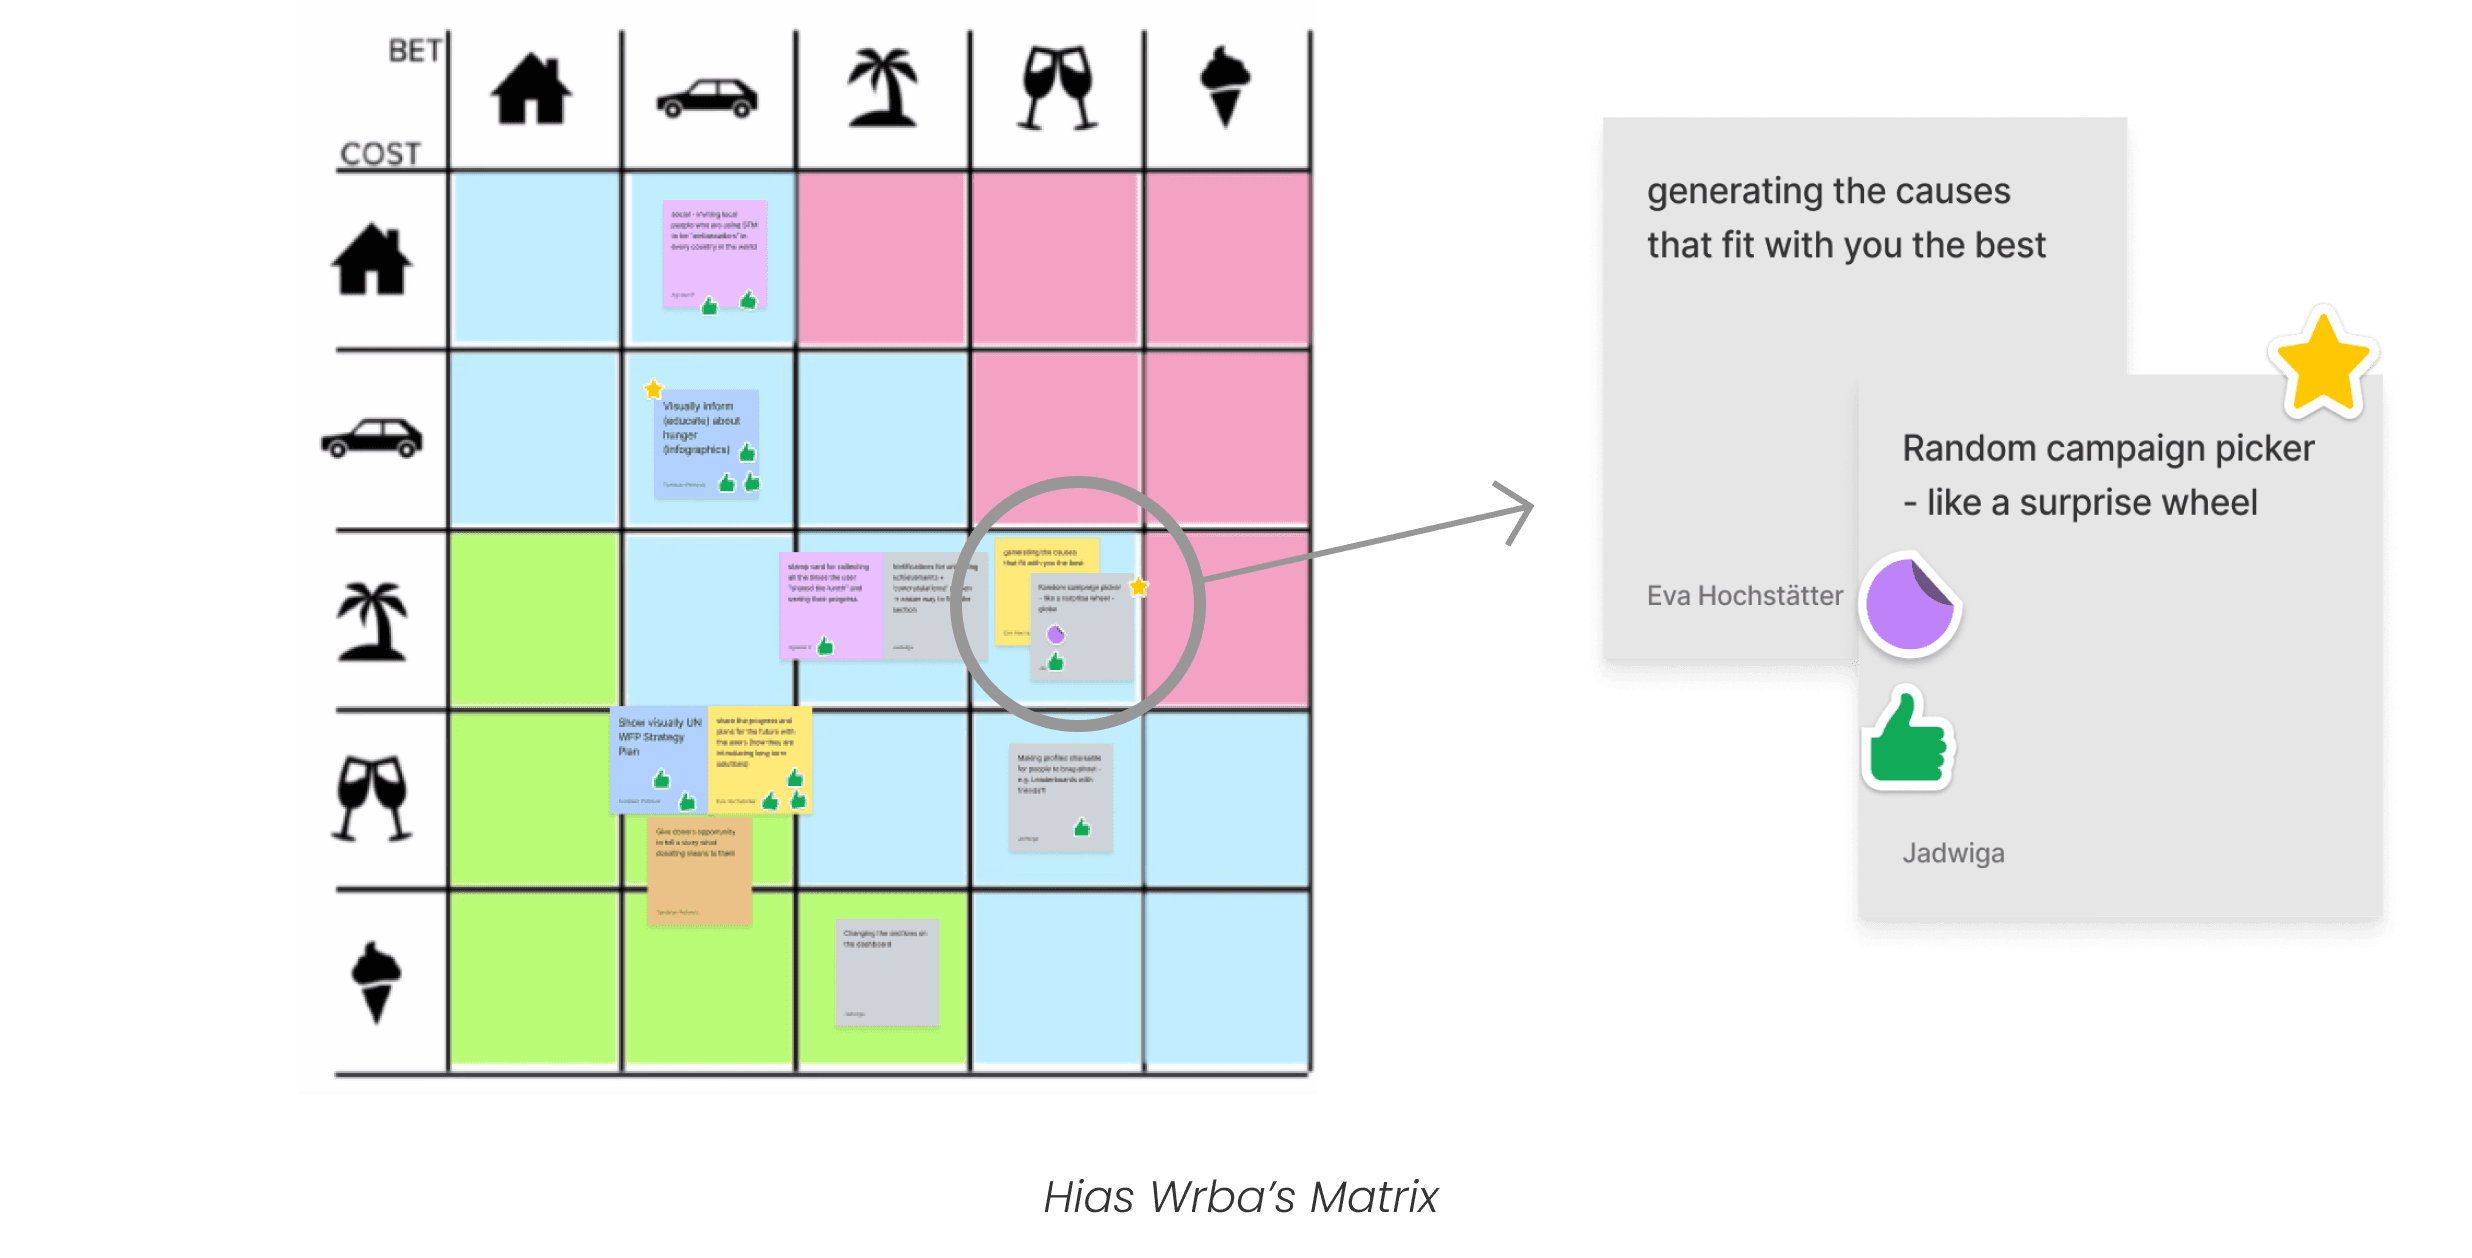
Where Ideas Begin: How-Might-We + Hias Wrba’s Matrix
We reframed our findings into How-Might-We questions and used Hias Wrba’s Matrix to prioritize ideas based on feasibility and potential impact. One idea consistently stood out:
A random campaign picker.
It seemed simple, even playful—a way to reduce the emotional pressure of choosing one cause over another. Instead of forcing users to compare dozens of campaigns, we wondered:
What if the app helped you decide when you didn’t know where to start?
This idea became the core of the feature we explored.
Bringing the Concept to Life
With our ideas defined, we translated them into quick pen-and-paper sketches, then developed medium-fidelity wireframes that shaped the foundation of our interactive prototype.
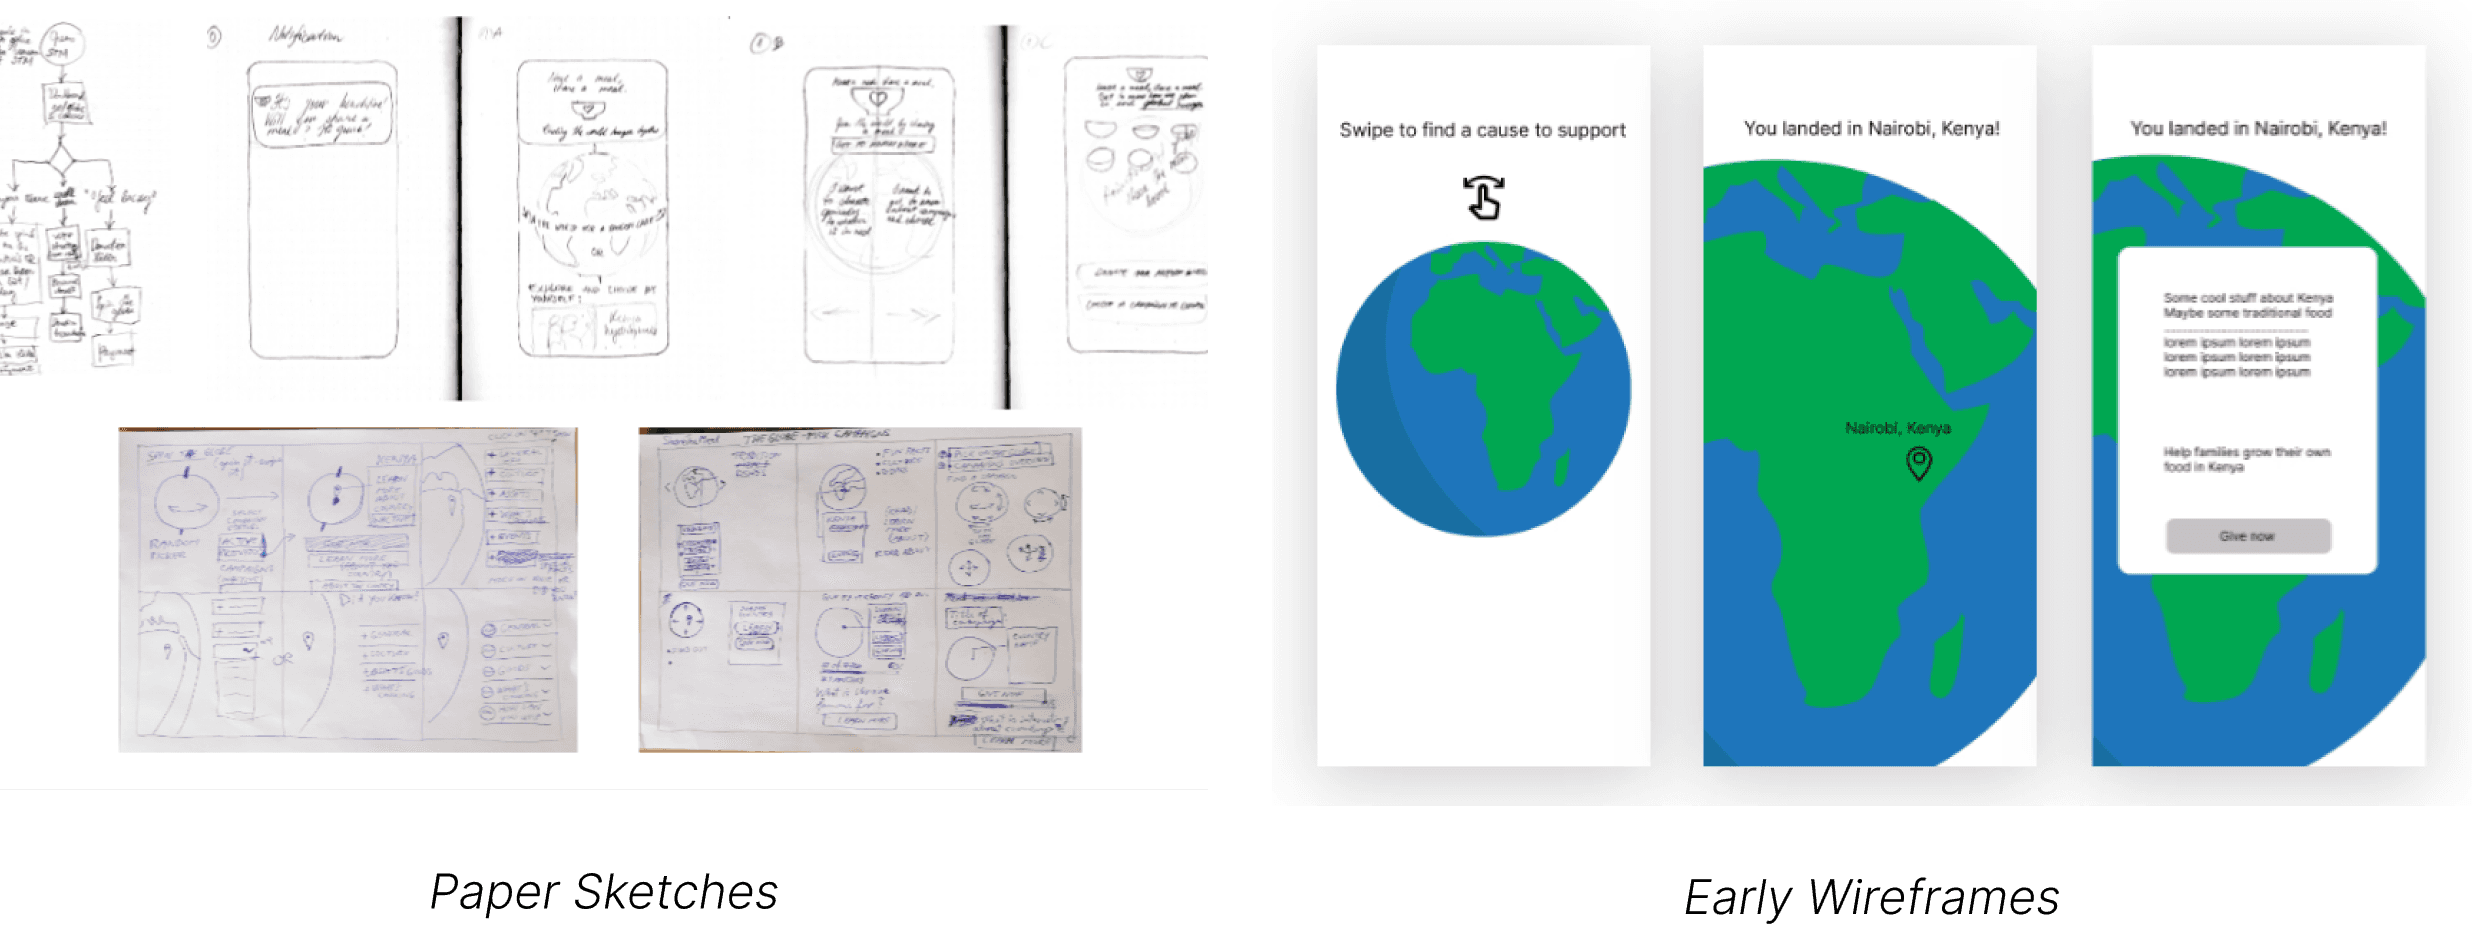
The goal was to create an experience that felt organic, quick, and emotionally light.
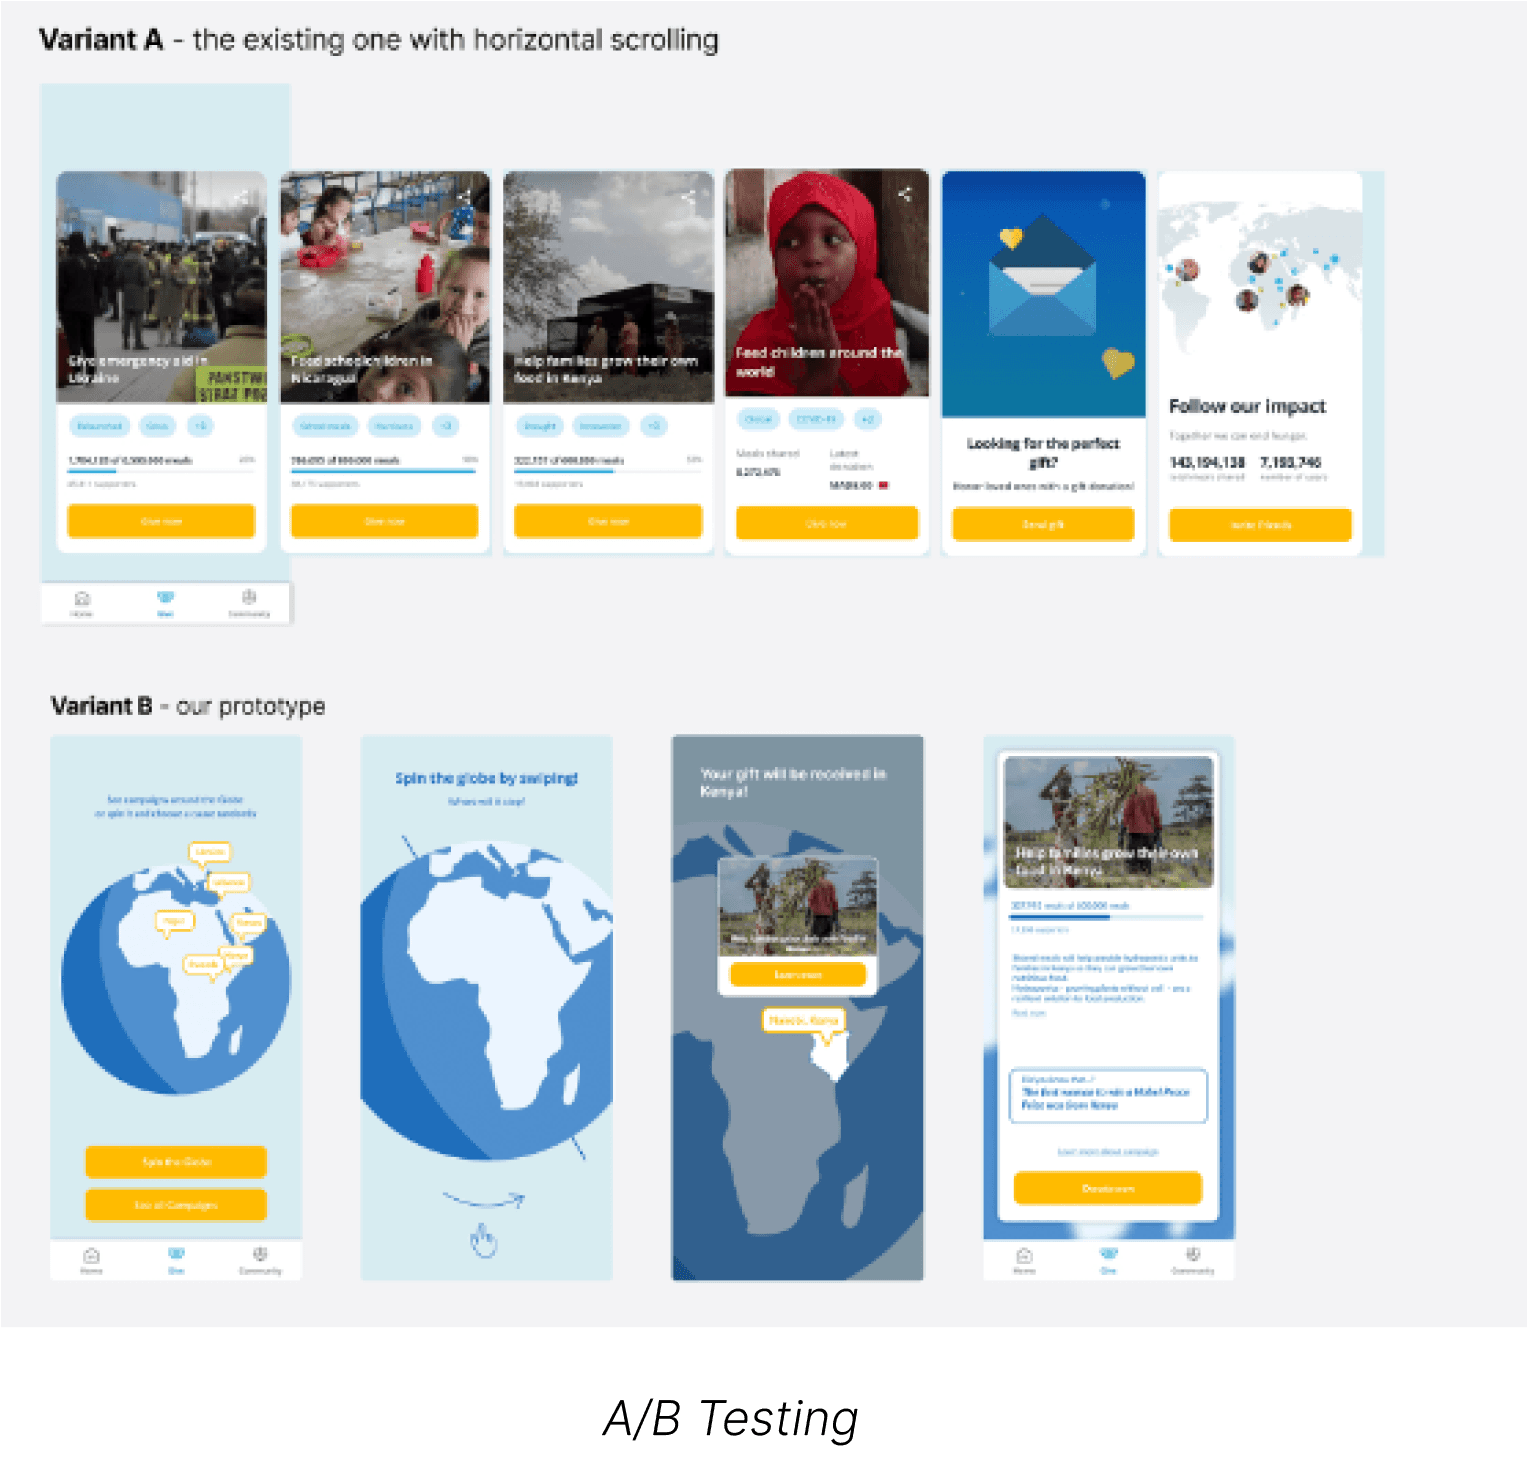
To evaluate its potential, we ran A/B tests with 11 users—comparing our prototype with the current version of the app.
Our hypothesis was straightforward:
The picker would make the decision process easier, quicker, and more engaging.
What We Learned
Testing revealed several important insights:
Users loved exploring campaigns visually—through the globe view, photos, and videos
Location-based browsing helped people connect emotionally with a cause
The random picker was fun, but not necessarily helpful for making an informed choice
Users preferred discovering campaign details gradually rather than being given everything upfront
What became clear was that the picker solved the problem of choice overload—but not the problem of clarity. Users enjoyed the interaction, but still needed more information to feel confident donating.
Reflections
This project highlighted an important truth about designing for impact-focused products: trust is not a feature—it’s an experience.
The random picker opened the door to a more playful interaction, but the real value lies in helping users understand where their money goes and why it matters. If I were to continue this exploration, I’d focus more on transparency tools—visual timelines, progress updates, or human-centered stories that make impact feel tangible.
In the end, meaningful engagement comes from more than convenience.
It comes from connection.
And that’s the space where design can make the greatest difference.